Monitoring
Configure the new Azure Monitoring Agent and Data Collection Rules. Optionally integrate with Azure Security Center and Azure Sentinel.
Azure Monitoring Agent (AMA)
-
Confirm the Azure Monitoring Agent is on our virtual machines via the Extensions pane
Should be already done by the policy, but if not…*
To be installed via Extension - either via PowerShell, CLI or ARM template: Install the Azure Monitor agent (preview)
Set-AzVMExtension -Name AMAWindows -Publisher Microsoft.Azure.Monitor -ExtensionType AzureMonitorWindowsAgent -VMName <virtual-machine-name> -ResourceGroupName <resource-group-name> -Location <location>az connectedmachine extension create --name AzureMonitorWindowsAgent --publisher Microsoft.Azure.Monitor --type AzureMonitorWindowsAgent --machine-name <arc-server-name> --resource-group <resource-group-name> --location <arc-server-location>The linux version is unsurprisingly called AzureMonitorLinuxAgent.
-
Confirm the virtual machines are communicating to the Log Analytics Workspace
Check the
Heartbeattable within the Log Analytics Workspace.This may be the arc-pilot-ama or the default ASC one, e.g.:
/subscriptions/<subId>
/resourcegroups/defaultresourcegroup-suk
/providers/microsoft.operationalinsights/workspaces
/defaultworkspace-<subscriptionId>-suk
Not entirely sure.
-
Ensure that the Log Analytics Workspace is set up so that users only have access to the logs of resources they have acces to
Confirm that the Access control mode on the Log Analtics Workspace is set to
Use resource or workspace permissions. The other mode isRequire workspace permissions. This can be viewed on the Log Analytics overview section and changed within the Log Analytics Workspace under Properties
Data Collection Rules (DCRs)
Security Operations Centers (SOC) team
You are part of the Security Operations Centers (SOC) team.
-
Set up a Data Collection Rule for all your Azure arc virtual machines to send their authentication logs to
-
Create a DCR under Azure Monitor.
- Name:
arc-dcr-soc - Platform Type:
Custom - Resources:
Select the Arc servers - Collect and Deliver
- Data Source Type:
Linux syslog:- LOG_AUTH
LOG_DEBUG - LOG_AUTHPRIV
LOG_DEBUG - All others as
None- saves ingestion and data storage costs.
- LOG_AUTH
- Data Source Type:
Windows event logs:- Select
Audit successandAudit failure
- Select
- Name:
-
(Optional) Validate the security logs are visible in the Log Analytics Workspace
-
For Windows:
Event
| where EventLog == "Security"
-
Cost Management team
You are part of the Cost Management team and performing an exercise on reducing costs.
-
Deploy a Data Collection Rule to collate the RAM usage data and % of free disk space for all VMs
-
Create a DCR under Azure Monitor.
- Name:
arc-dcr-costmanagement - Platform Type:
Custom - Resources:
Select the Arc servers - Collect and Deliver
- Data Source Type:
Performance Counters- Select
Custom - Then select:
\Memory\% Committed Bytes In Use\LogicalDisk(_Total)\% Free Space
- Select
- Name:
-
(Optional) Produce a workbook showing the % utilisation of CPU, RAM and free disk space for all VMs
- Naviagate to Azure Monitor in the Azure Portal
- Select Workbooks on the left hand menu
- Create a workbook with two visualations or alternatively, use the GitHub Azure Monitor Workbook Community
Linux Application Team
You are part of a Linux application team.
-
(Optional) Deploy a Data Collection Rule to collate any system errors and send to a Log Analytics Workspace
-
Create a DCR under Azure Monitor.
- Name:
arc-dcr-linux - Platform Type:
Linux - Resources:
Select the Arc servers - Collect and Deliver
- Data Source Type:
Linux syslog:LOG_WARNINGon all categories - saves ingestion and data storage costs.- Could argue
LOG_DEBUGon all however as not specified if development environment
- Name:
-
(Optional) Create an Azure Monitor Alert to notify the application team on an error
- Navigate to the Azure Monitor
- Alerts on the left hand menu
- Create a log alert to alert on the errors
Dashboarding
As you go through this section, note the queries you use; as we are using solutions not enabled yet for Azure Monitoring Agent, the focus is on the Microsoft Monitoring Agent (MicrosoftMonitoringAgent and OmsAgentForLinux).
UPDATE FOR AMA?
Log Management
Produce a query to highlight which machines are reporting to the Log Analytics Workspace.
Heartbeat
| summarize LastContact=max(TimeGenerated) by Computer
Update Management
Produce a query to highlight which machines require updates. (N.B. you will need to use summarize and arg_max)
Update
| summarize arg_max(TimeGenerated, *) by Computer, Title, Classification, UpdateID
| where UpdateState == "Needed"
| summarize MissingUpdatesCount = count() by Computer
Arc Management
Produce a query highlighting if our estate is compliant with the Virtual Machine extensions. (N.B. you will need to use Azure Resource Graph)
PolicyResources
| where type == 'microsoft.policyinsights/policystates'
| extend policyAssignmentScope=tostring(properties.policyAssignmentScope),
policySetDefinitionName=tostring(properties.policySetDefinitionName),
policyDefinitionName=tostring(properties.policyDefinitionName),
subscriptionId=tostring(subscriptionId),
ComplianceState=tostring(properties.complianceState)
| summarize PoliciesDefinitions=dcount(policyDefinitionName), PolicyInitiatives=dcount(policySetDefinitionName), NonCompliantResources=countif(ComplianceState=="NonCompliant")
resources
| where type == "microsoft.hybridcompute/machines/extensions"
| extend vm=tostring(split(id,"/")[8])
| summarize countif(name in ("MicrosoftMonitoringAgent","OMSAgentForLinux")) by vm
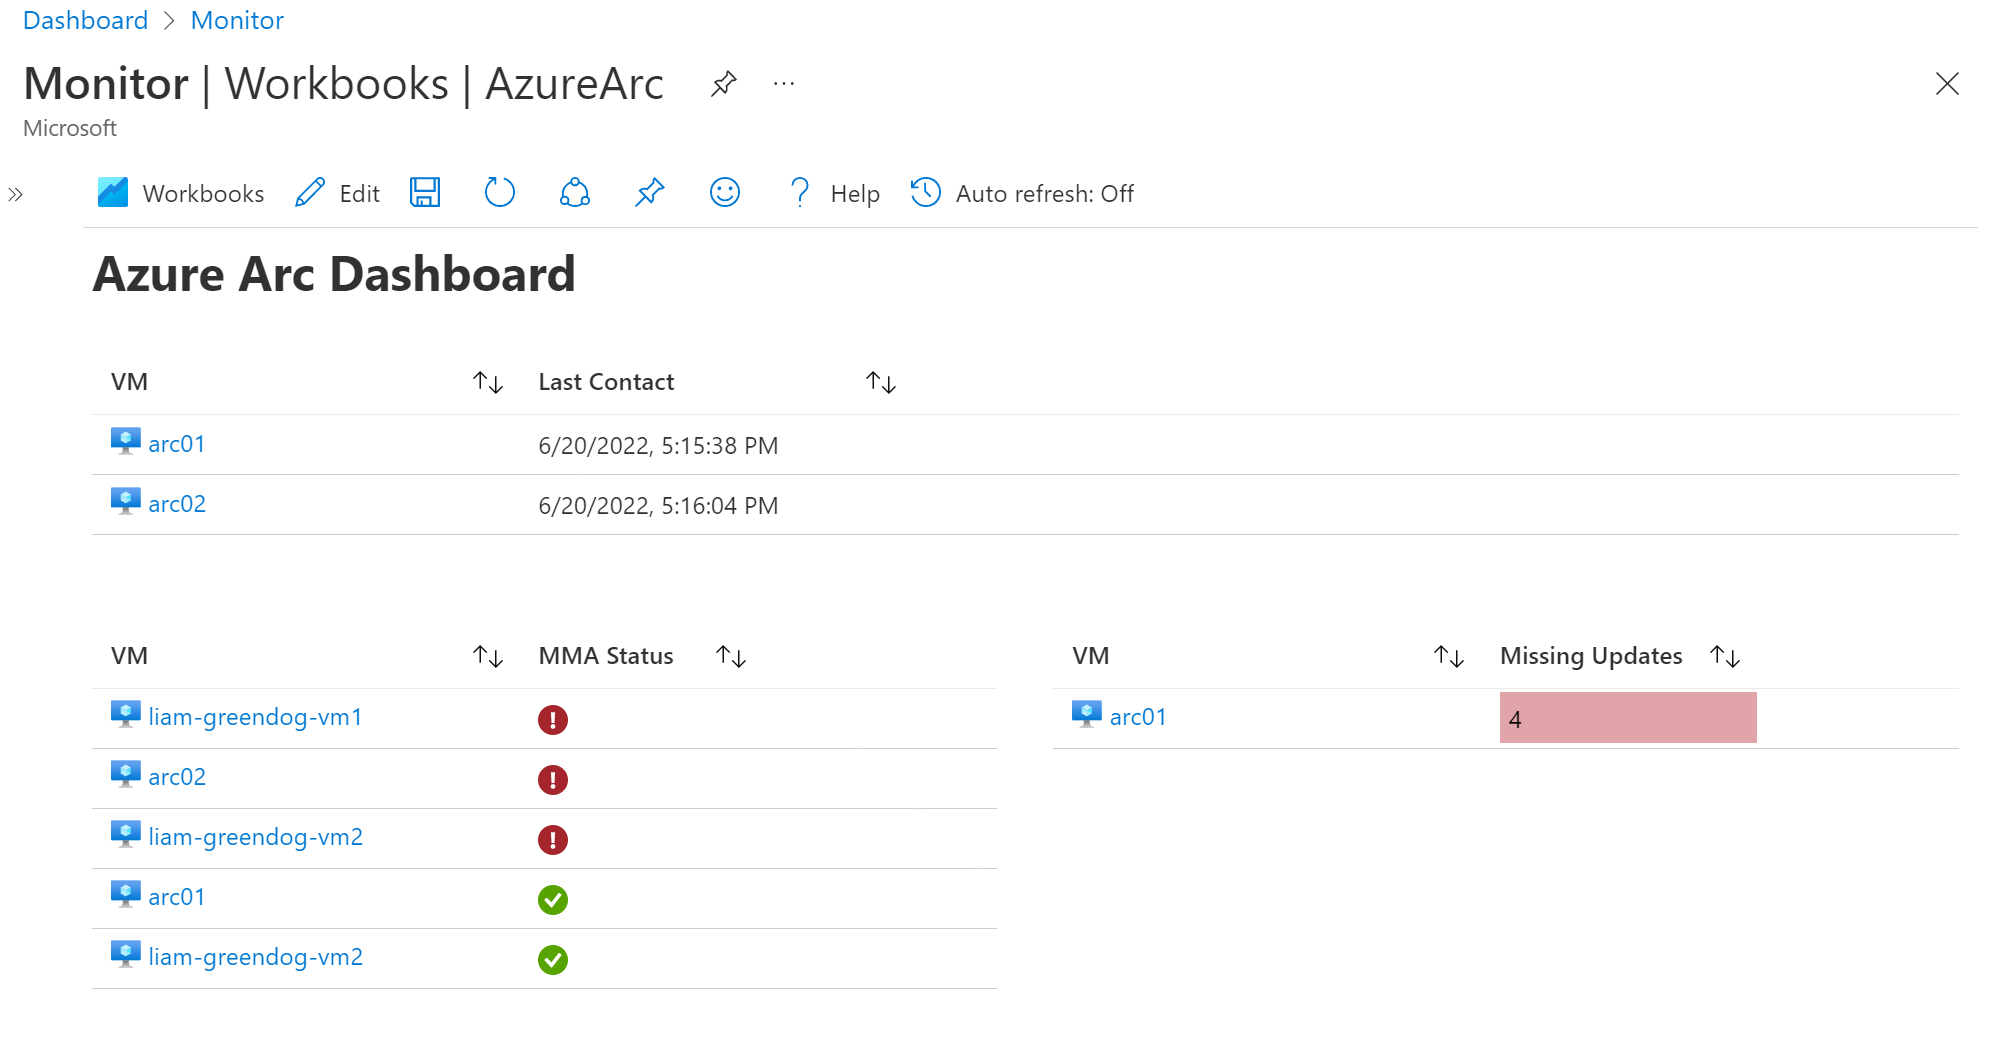
Azure Monitor Workbook
Create an Azure Monitor Workbook showcasing your KQL queries. Feel free to use graphs or charts.
{
  "version": "Notebook/1.0",
  "items": [
    {
      "type": 1,
      "content": {
        "json": "# Azure Arc Dashboard"
      },
      "name": "text - 0"
    },
    {
      "type": 3,
      "content": {
        "version": "KqlItem/1.0",
        "query": "Heartbeat\r\n| summarize LastContact=max(TimeGenerated) by ResourceId",
        "size": 4,
        "timeContext": {
          "durationMs": 86400000
        },
        "queryType": 0,
        "resourceType": "microsoft.operationalinsights/workspaces",
        "crossComponentResources": [
          "/subscriptions/679bfca2-ae52-45e8-b890-c26560f2eca0/resourceGroups/arcHack/providers/Microsoft.OperationalInsights/workspaces/arcHack-mma"
        ],
        "gridSettings": {
          "labelSettings": [
            {
              "columnId": "ResourceId",
              "label": "VM"
            },
            {
              "columnId": "LastContact",
              "label": "Last Contact"
            }
          ]
        }
      },
      "name": "query - 1"
    },
    {
      "type": 3,
      "content": {
        "version": "KqlItem/1.0",
        "query": "resources\r\n| where type == \"microsoft.compute/virtualmachines/extensions\"\r\n| extend computerId = strcat(\"/\",strcat_array(array_slice(todynamic(split(id,\"/\")),1,8),\"/\"))\r\n| summarize countif(name==\"MicrosoftMonitoringAgent\") by computerId",
        "size": 1,
        "queryType": 1,
        "resourceType": "microsoft.resourcegraph/resources",
        "crossComponentResources": [
          "/subscriptions/679bfca2-ae52-45e8-b890-c26560f2eca0"
        ],
        "gridSettings": {
          "formatters": [
            {
              "columnMatch": "countif_",
              "formatter": 18,
              "formatOptions": {
                "thresholdsOptions": "icons",
                "thresholdsGrid": [
                  {
                    "operator": "==",
                    "thresholdValue": "0",
                    "representation": "3",
                    "text": ""
                  },
                  {
                    "operator": "Default",
                    "thresholdValue": null,
                    "representation": "success",
                    "text": ""
                  }
                ]
              }
            }
          ],
          "labelSettings": [
            {
              "columnId": "computerId",
              "label": "VM"
            },
            {
              "columnId": "countif_",
              "label": "MMA Status"
            }
          ]
        }
      },
      "customWidth": "50",
      "name": "query - 2"
    },
    {
      "type": 3,
      "content": {
        "version": "KqlItem/1.0",
        "query": "Update\r\n| summarize arg_max(TimeGenerated, *) by Computer, Title, Classification, UpdateID, _ResourceId\r\n| where UpdateState == \"Needed\" \r\n| summarize MissingUpdatesCount = count() by Computer, _ResourceId",
        "size": 1,
        "queryType": 0,
        "resourceType": "microsoft.operationalinsights/workspaces",
        "crossComponentResources": [
          "/subscriptions/679bfca2-ae52-45e8-b890-c26560f2eca0/resourceGroups/arcHack/providers/Microsoft.OperationalInsights/workspaces/arcHack-mma"
        ],
        "gridSettings": {
          "formatters": [
            {
              "columnMatch": "Computer",
              "formatter": 5
            },
            {
              "columnMatch": "MissingUpdatesCount",
              "formatter": 8,
              "formatOptions": {
                "min": 0,
                "max": 10,
                "palette": "red"
              }
            },
            {
              "columnMatch": "countif_",
              "formatter": 18,
              "formatOptions": {
                "thresholdsOptions": "icons",
                "thresholdsGrid": [
                  {
                    "operator": "==",
                    "thresholdValue": "0",
                    "representation": "3",
                    "text": ""
                  },
                  {
                    "operator": "Default",
                    "thresholdValue": null,
                    "representation": "success",
                    "text": ""
                  }
                ]
              }
            }
          ],
          "labelSettings": [
            {
              "columnId": "_ResourceId",
              "label": "VM"
            },
            {
              "columnId": "MissingUpdatesCount",
              "label": "Missing Updates"
            }
          ]
        }
      },
      "customWidth": "50",
      "name": "query - 2 - Copy"
    }
  ],
  "$schema": "https://github.com/Microsoft/Application-Insights-Workbooks/blob/master/schema/workbook.json"
}
Integrate with Microsoft Defender for Cloud
-
Enable Microsoft Defender for Cloud on your Azure Arc connected machines
- In the Azure portal, navigate to the Security Center blade, select Security solutions, and then in the Add data sources section select Non-Azure servers.
- On the Add new non-Azure servers blade, select the + Add Servers button referencing the Log Analytics workspace you created in the previous task.
- Navigate to the Security Center | Pricing & settings blade and select the Log Analytics workspace.
- On the Security Center | Getting Started blade and enable Azure Defender on the Log Analytics workspace.
- Navigate to the Settings | Azure Defender plans blade and ensure that Azure Defender is enabled on 1 server.
- Switch to the Settings | Data collection blade and select the Common option for collection of Windows security events.
- Navigate to the arcch-vm1 blade, select Security, an verify that Azure Defender for Servers is On.
Integrate with Azure Sentinel
-
Enable Azure Sentinel on your Azure Arc connected machines by configuring the Log Analytics agent to forward events to Azure Sentinel such as Common Event Format (CEF) or Syslog
- In the Azure portal, connect Azure Sentinel to the Log Analytics workspace you created in the previous challenge.
Success criteria
Screen share with your proctor to show that you achieved:
-
Azure Monitoring Agent (AMA) is reporting to your new Log Analytics Workspace
-
Validate that all Arc machines are reporting to the new Log Analytics Workspace
Heartbeat
| summarize by Computer
-
-
Data Collection Rules are applied and data is being gathered from the Azure arc connected machines
- Azure Monitor from the Azure Portal
- Select Data Collection Rules
- Ensure the two/three rules have been created and the DCRs have the servers selected as sources
-
Open Azure Security Center and view the Secure Score for your Azure arc connected machine
- Alternatively, review the Security Center | Inventory blade and verify that it includes the Servers - Azure Arc entry representing the arcch-vm1 Hyper-V VM.
-
From Azure Sentinel, view collected events from your Azure Arc connected machine
- In the Azure portal, navigate to the Azure Sentinel | Data Connectors blade, select Security Events entry, and then select Go to analytics.